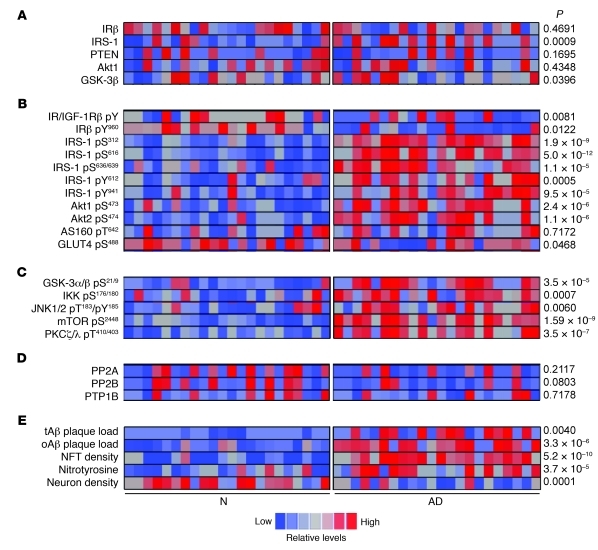
Figure 6. CA1 pyramidal cells in AD display marked elevation in cytosolic levels of IRS-1 pS species and their activated kinases.
The heat map summarizes relative basal levels of select insulin signaling molecules (A), activation states of those and related molecules (B), activation states of IRS-1 serine kinases (C), protein phosphatases that regulate insulin signaling (D), and neuropathological parameters (E). Data are shown for the 24 N and 24 matched AD cases in the UPenn cohort. Each row displays mean qIHC data on the respective analyte; each cell shows mean cellular levels of an analyte in a given case relative to all 48 cases studied. See Table 5 for measures used to quantify each analyte. P values denote differences between N and AD cases. Note that AD cases typically showed high levels of IRS-1 pS species and of activated IRS-1 pS kinases (GSK-3, IKK, JNK, mTOR, and PKCζ/λ). All amino acid sequence numbers are for the human proteins. tAβ, total Aβ; oAβ, oligomeric Aβ.

