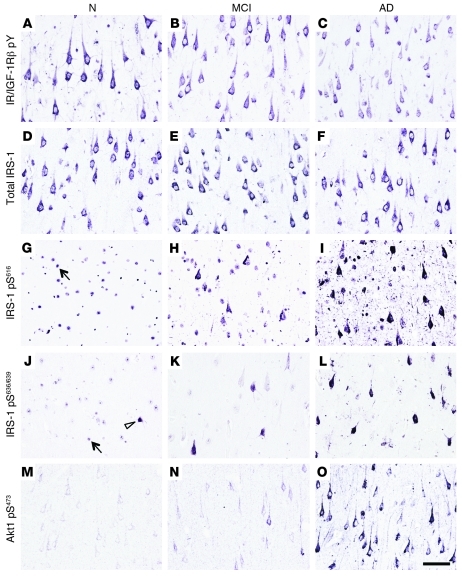
Figure 7. Key insulin signaling molecules seen immunohistochemically in CA1 neurons of N, MCI, and AD cases of the ROS cohort.
See Table 5 for numeric data on the antigens. IR/IGF-1Rβ pY (A–C) was reduced in MCI. Total neuronal IRS-1 (D–F) was not reduced in MCI or AD. IRS-1 pS was normally confined to cell nuclei (e.g., arrow in G) with few exceptions, but the density of neurons with detectable cytoplasmic IRS-1 pS616 (G–I) or IRS-1 pS636/639 (J–L) increased markedly from N to MCI to AD. What appears to be high background levels of IRS-1 pS616 in I was actually elevated antigen in the neuropil. (M–O) Akt1 pS473 was barely detectable in N cases, but the density of neurons with detectable cytoplasmic levels of the activated molecule rose markedly from N or MCI to AD. See Supplemental Figures 5 and 6 for other insulin signaling molecules studied in the ROS cohort. Scale bar: 70 μm.

