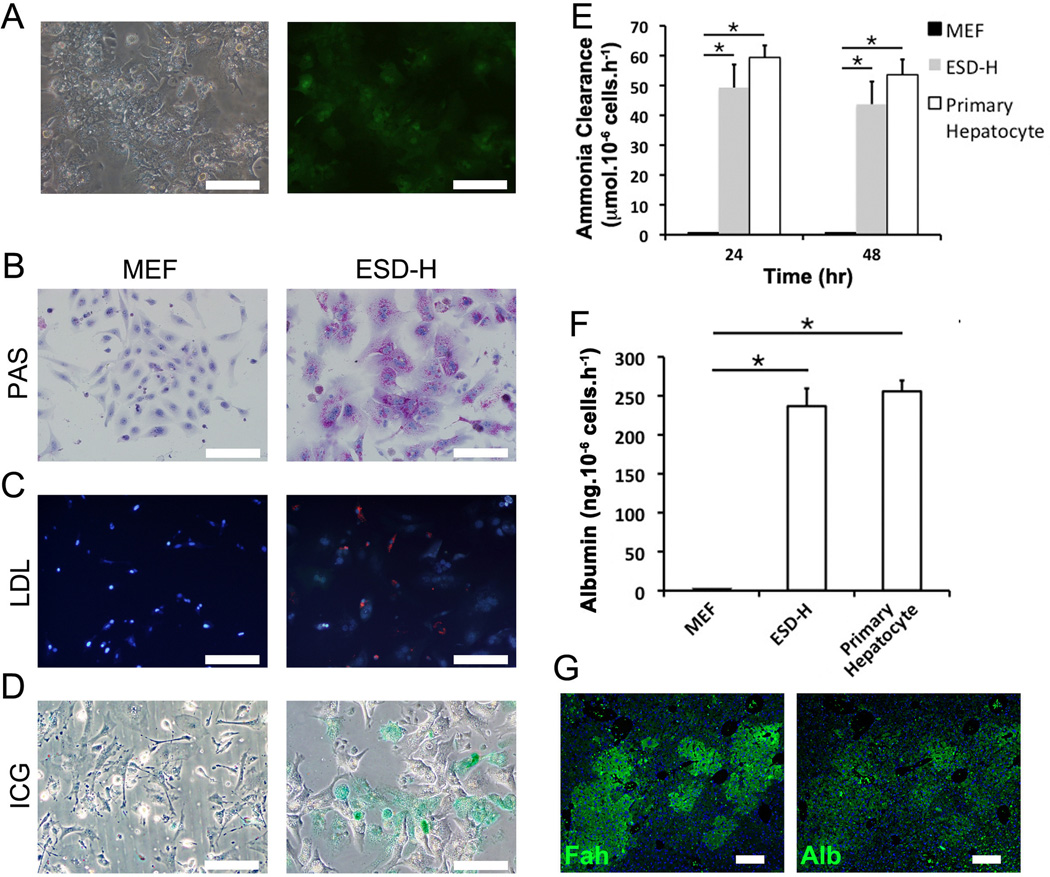
Figure 7. In vitro metabolic function of ES cell-derived hepatocytes.
(A) GFP expression as the purification marker to enrich ES cells-derived hepatocytes (ESD-H) after sorting. (B) Glycogen storage in ESD-H was stained as purple by PAS staining. (C) ac-LDL transportation into ESD-H was analyzed by DiI-ac-LDL uptake assay (red staining). (D) Cellular uptake of ICG in ESD-H (green staining). (E) Cellular ammonia clearance was observed in ESD-H culture supernatant. (F) The levels of albumin protein levels secreted in ESD-H culture mediums were measured by ELISA assay. (G) Immunofluorescence staining of albumin and FAH in ESD-H. *: p < 0.05. Scale bars: 200 µm.

