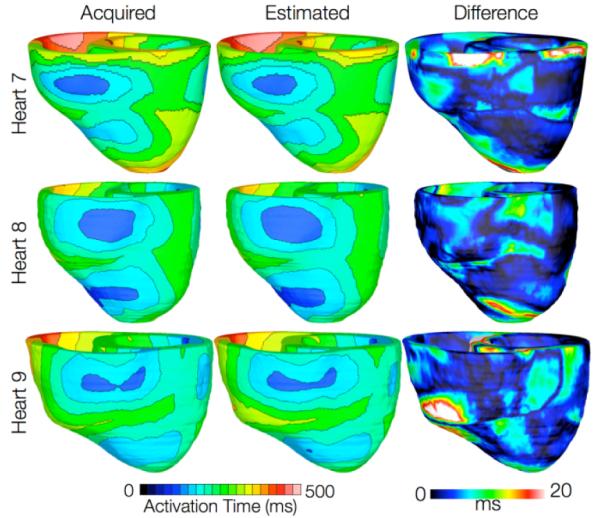
Fig. 5.

Results from simulations of one beat of sinus rhythm in failing heart models. In the first column, rows 1-3 show simulated activation maps with models 7-9, respectively. In the second column, rows 1-3 display results of simulations with models 10-12, respectively. Rows 1-3 in the third column illustrate the absolute difference between the activation maps shown in the first and second columns of the corresponding row.
