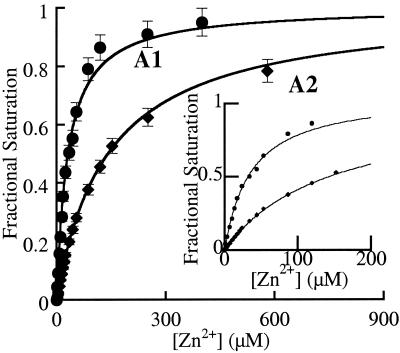
Figure 2.
Zinc binding curves for A1 (Kd = 56 μM) and A2 (Kd = 135 μM). Each data point represents the average of three separate titrations. (Inset) the goodness of fit at low zinc concentrations, with error bars removed for clarity. The data are fit to a hyperbolic binding isotherm (32).

