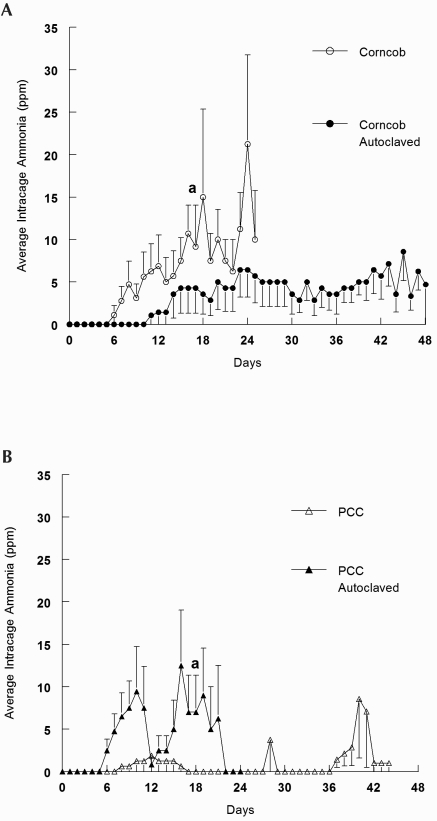
Figure 3.
Average daily ammonia concentration (ppm). The number of cages measured changed over time because cages were removed when the intracage NH3 concentration reached or exceeded 25 ppm (data for the date of removal are included). Data are presented for each group only until the average day of cage removal for each group. (a) Day after which fewer than 50% of cages remain. (A) Corncob (n = 9; a, day 17) and autoclaved corncob (n = 7) bedding; note that 71% (5) of cages containing autoclaved corncob bedding remained on day 48. (B) PCC (n = 8) and autoclaved PCC (n = 10; a, day 18) bedding; note that 63% (5) of cages containing PCC remained on day 44.

