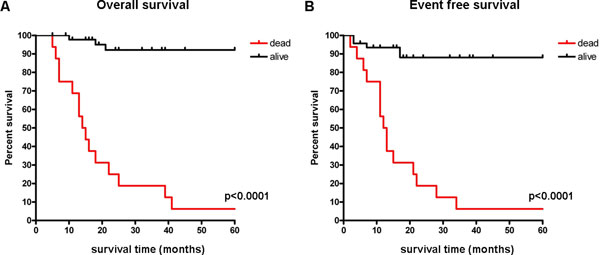
Figure 3.
Kaplan-Meier and log-rank analysis of patients stratified according to the NB-MuSE classifier. Kaplan-Meier and log-rank analysis for the 62 neuroblastoma patients belonging to the external validation dataset. 5-years overall survival (A) and event free survival (B) of patients stratified according to the NB-MuSE classifier. Red and black curves represent poor and good outcome patients respectively. The p-value of the log-rank test is shown.

