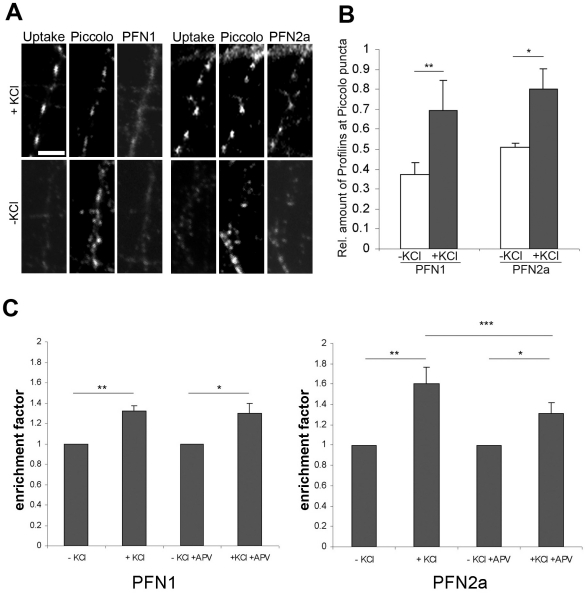
Figure 5. Both isoforms are enriched in activated synapses.
(A): Triple immunofluorescence images of cultured rat neurons either stimulated with 70 mM KCl or kept under control conditions (-KCl), while incubated with antibodies against synaptotagmin 1. The total population of synapses was identified by staining for piccolo (centre panels), while synapses with active synaptotagmin 1 uptake were identified by staining with the corresponding antibody (uptake, left panels). Staining for PFN1 or PFN2a is shown in the right panels. Note that active synapses display a much more prominent signal for PFN1 and PFN2a than inactive ones. Bar 5 µm. (B): Quantitative analysis of activity-dependent changes in PFN1- (left) or PFN2a- (right) immunoreactivity in piccolo-positive synapses. The immunoreactivity of piccolo is independent of synaptic activity and thus serves as a reference parameter for synaptic PFN1 and PFN2a. The Y-axis reflects the relative amounts of profilin at piccolo puncta. The graph shows the mean ± SEM, n = 200–500 terminals were analysed in 2–3 independent experiments; *P<0.05, **P<0.01, statistical analysis by paired t test. (C): Quantitative analysis of PFN1 and PFN2a enrichment (i.e., the fluorescence signal at a synapse divided by this signal in the neurite) in dendritic spines of hippocampal neurons after KCl stimulation with and without blocking of the postsynaptic (dendritic) NMDA-receptor by the antagonist APV (100 µM). Note that inhibition of the NMDA receptor did not alter the level of PFN1 in dendritic spines, whereas PFN2a was significantly reduced. The graph shows the mean ± SEM, n = 198–296 synapses were analysed; * P<0.05, ** P<0.01, *** P<0.005, statistical analysis by paired t test.

