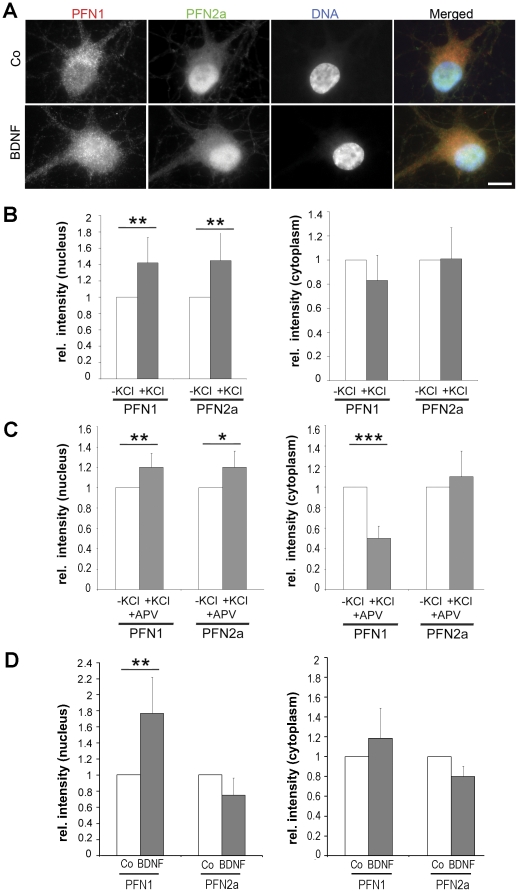
Figure 7. BDNF treatment results in an enrichment of PFN1 in nuclei of rat hippocampal neurons.
(A): Images of non-stimulated (co) and stimulated (BDNF) hippocampal neuronal cell bodies stained for PFN1 and PFN2a and counterstained with DAPI. Bar: 10 µm. (B, C): Rat hippocampal neurons at DIV14 were treated with KCl in the presence and absence of the antagonist APV. Statistical analysis of profilin levels in the nucleus and the cytoplasm as monitored by immunofluorescence, in relation to synaptic activity. (B): fluorescence intensity of nuclear and cytoplasmic areas with and without KCl stimulation. (C): Analogous analysis with and without blocking the postsynaptic NMDA receptor by the antagonist APV. Paired t test; * P<0.05, ** P<0.01, *** P<0.005 (28–60 cells (B), respectively 100–129 (C) cells from 2 to 3 independent experiments were analysed). (D): Fluorescence intensity in the nuclear and the cytoplasmic compartment of neurons treated with BDNF or BSA (co) at DIV9. Paired t test; ** P<0.01 (30–50 cells from 3 independent experiments were analysed).

