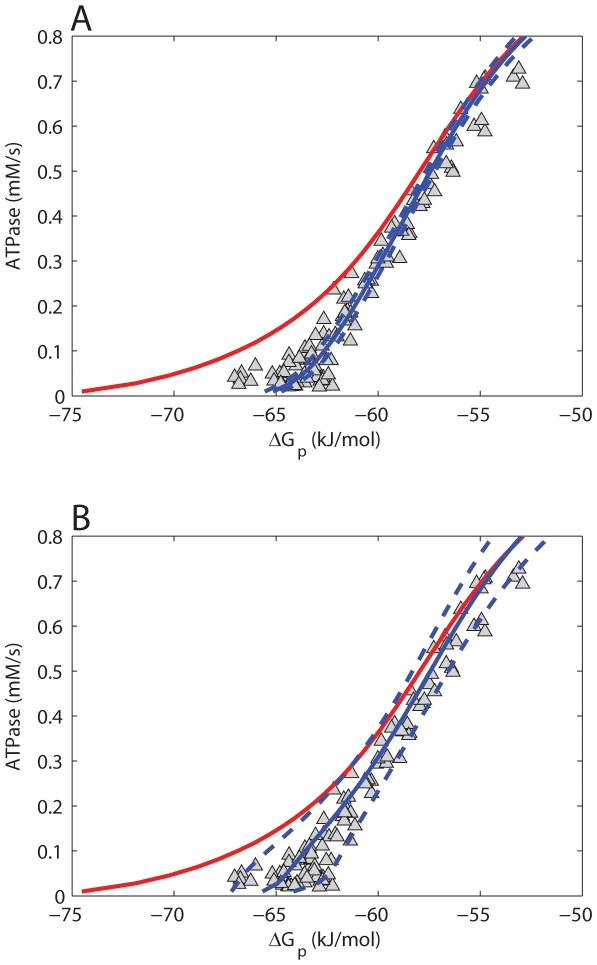
Figure 3. Model predictions of the ΔGp - Jp relation.
Model predictions of the relation between cellular phosphate potential (ΔGp) and mitochondrial ATP synthetic flux (ATPase) according to model configuration i (metabolic feedback regulation) (A), model configuration ii (regulation by parallel activation) (B). Model predictions are indicated as the mean (solid blue line) and STD (dotted blue line) of the 1000 simulations that were run in a Monte Carlo approach. Predictions of the original model are shown in red. Experimental data points are indicated by Δ. Data points were obtained from [14].

