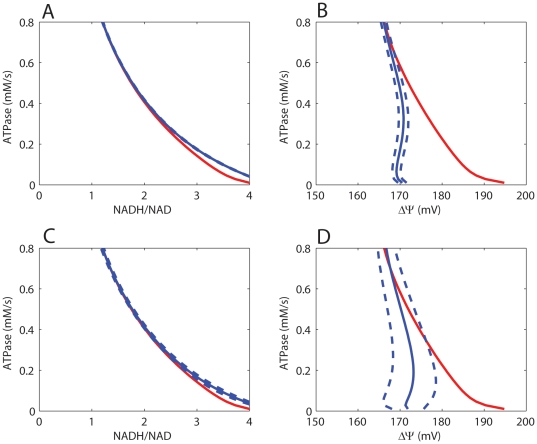
Figure 4. Model predictions of mitochondrial redox state (NADH/NAD) and membrane potential (ΔΨ).
Model predictions of mitochondrial redox state (NADH/NAD) and membrane potential (ΔΨ) at different cellular ATP demand fluxes according to model configuration i (A–B) and model configuration ii (C–D). Model predictions are indicated as the mean (solid blue line) and SD (dotted blue line) of the 1000 simulations that were run in a Monte Carlo approach. Predictions of the original model are shown in red.

