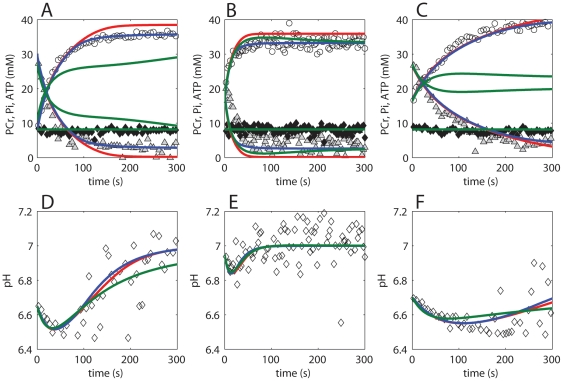
Figure 6. Model predictions versus 31P MRS observed metabolite dynamics during post exercise recovery period.
Experimental data and model simulations of a healthy control subject (A,D), athlete (B,E) and subject with a sedentary lifestyle (C,F) are shown. Model simulations according to the original model, model configuration i and model configuration ii are indicated by red, blue and green lines respectively. Experimental data of PCr, Pi, ATP and pH are indicated by open circles, grey triangles, closed diamonds and open diamonds respectively.

