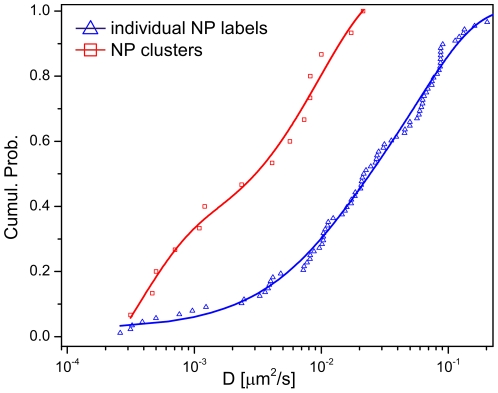
Figure 8. Comparison of diffusion coefficient (D) distributions for individual NPs and NP clusters.
The graphs show the cumulative distributions of the D values of individual NP labels (blue) and of NP clusters (red). The D value distribution of the clusters is systematically shifted to lower values when compared with that of individual NPs.

