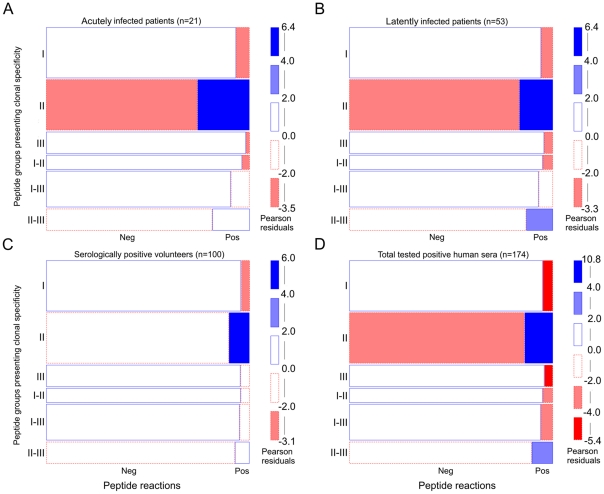
Figure 2. Statistically significant overrepresentation of reactions against clonal type II specific peptides.
To determine whether reactions against certain clonal type-specific peptide cohorts (I, II, III, I–II, I–III, or II–III) were over- or underrepresented in various groups of T. gondii positive human sera a log-linear model analysis was performed and visualized by mosaic plot: acutely infected individuals (A), latently infected individuals (B) serologically positive volunteers (forest workers) (C) and all tested positive human sera (D). The size of each box corresponds to the observed frequencies of positive (Pos) and negative (Neg) peptide reactions as well as the number of tested peptides within each clonal type-specific peptide cohort. Pearson residuals represent standardized deviations of observed from expected values. The solid blue line indicates that the number of positive or negative reactions is higher than expected but not statistically significant. Blue scale shadings suggest the statistically significant rejection of the null hypothesis, i.e. overrepresentation of certain type-specific peptide reactions (Pearson chi-squared p-value<0.05). Dashed red lines indicate an underrepresentation of positive or negative peptide reactions which is not statistically significant. Red scale shadings suggest a statistically significant rejection of the null hypothesis, i.e. underrepresentation of peptide reactions within tested peptide and human groups (Pearson chi-squared p-value<0.05).

