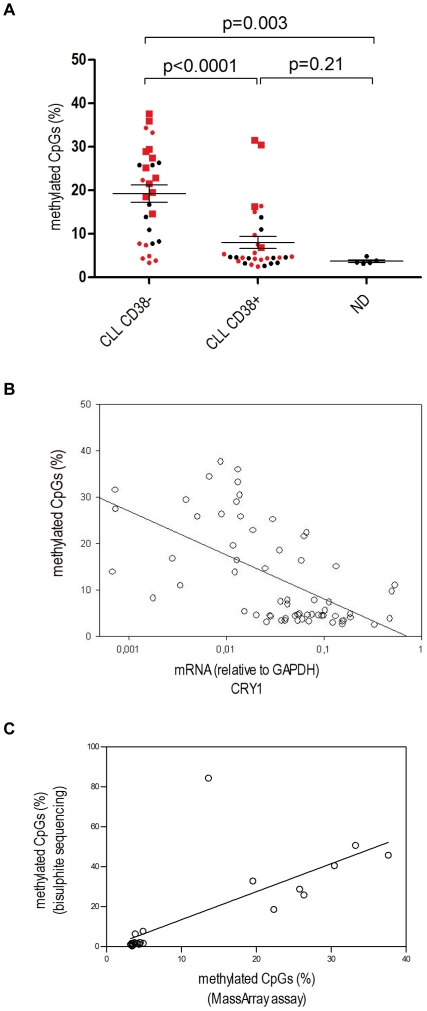
Figure 3. Analysis of CRY1 CpG island promoter methylation status measured with the Bisulphite MassArray assay.
A Results of CRY1 CpG island methylation analysis performed on CLL samples and normal donors (ND) grouped by CD38 expression (CD38− samples, n = 28; CD38+ samples, n = 30; ND, n = 5). Each value represents the average amount of methylated CpGs of all analyzable CpGs within the CpG island promoter from one patient. The values represent the mean of duplicate experiments. The IgVH mutational status of each patient (if available) is highlighted in red; circles and squares indicate unmutated IgVH/V3-21 and mutated IgVH status, respectively. The median is marked as a line, error bars indicate SEM. Unpaired two-tailed t-test was used to compute p-values. B Samples from CLL patients and ND were subjected to both CRY1 mRNA expression and DNA methylation analysis with the bisulphite MassArray assay. mRNA expression values and percentage of methylated CpG were found to be highly correlated (r = −0.63, p<0.0001, Spearman correlation). The regression line in the plot was produced by linear regression analysis using promoter methylation as dependent and CRY1 mRNA expression as independent variable. C Correlation between the methylation data resulting from bisulphite genomic sequencing and the MassArray method showed high consistency (r = 0.86, p<0.0001, Spearman correlation).

