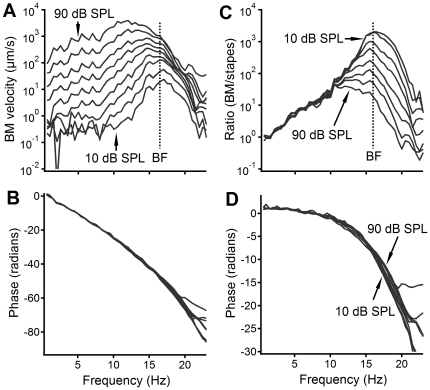
Figure 3. The BM vibration measured from a longitudinal location ∼2.5 mm from the cochlear base.
The magnitude (A), phase (B), the magnitude ratio of the BM to the stapes (C), and phase difference between the stapes and BM (D) are presented as a function of frequency. Panels A and C show high sensitivity, sharp tuning, and nonlinear compression while panels B and D show that the phase decreases with frequency at an accelerated rate, indicating cochlear dispersion.

