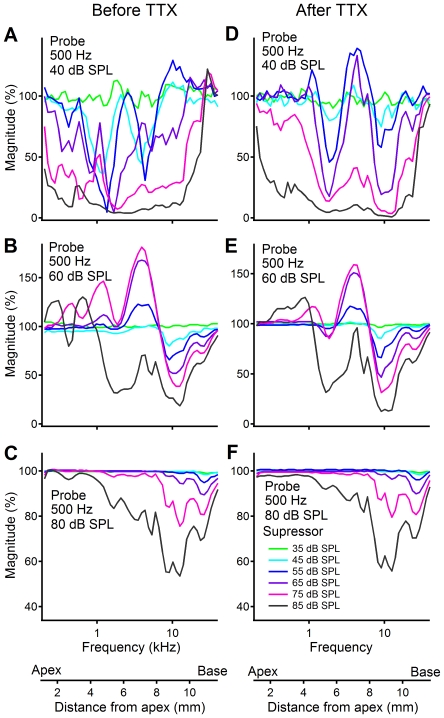
Figure 6. Magnitude of the RW CM as a function of suppressor frequency before (panels A, B, and C) and after (panels D, E, and F) TTX application.
The RW CM was evoked by 500-Hz probe tones at 40 (panels A and D), 60 (panels B and E), and 80 (panels C and F) dB SPL, and suppressing tone levels were 35, 45, 55, 65, 75, and 85 dB SPL. For 40-dB probe tones and intermediate suppressor levels, the RW CM was suppressed mainly at ∼1.8 kHz (panels A and D) and ∼4 kHz (panel A) or ∼10 kHz (panel D). At 60-dB SPL probe level, suppression near ∼10 kHz is more significant than that near ∼1.8 kHz despite suppressor-induced CM increase at other frequencies (panels B and E). At 80-dB SPL probe-tone level, CM suppression occurred dominantly at high frequencies ≥10 kHz. After the ANN is eliminated by TTX, suppression curves in panel D become more regular than those in panel A.

