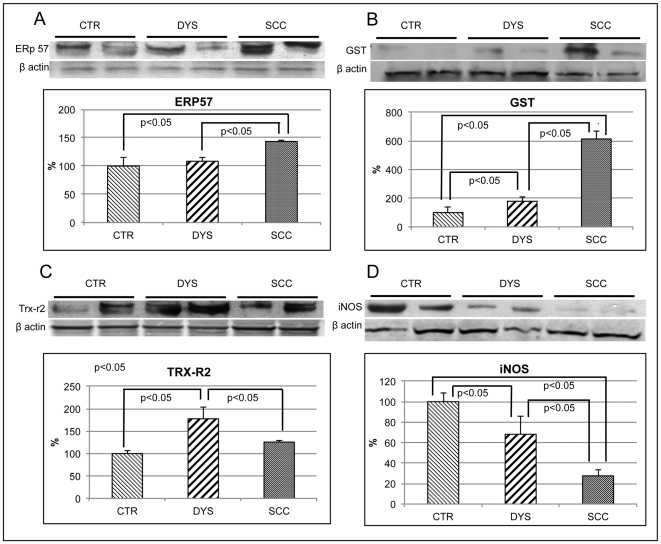
Figure 2. Expression levels of stress markers (ERp57, GST, TRX-R2 and iNOS).
Protein expression levels in CTR, DYS and SCC cervical tissues were measured by Western blot analysis using specific antibodies for ERp57 (A), GST (B), TRX-R2 (C) and iNOS (D). Immunoblots were scanned by densitometry and all values were normalized to β-actin levels. Densitometric values shown are given as percentage of the control group, set as 100%. Data are expressed as mean ± SEM. p<0.05 versus control (Student's t-test).

