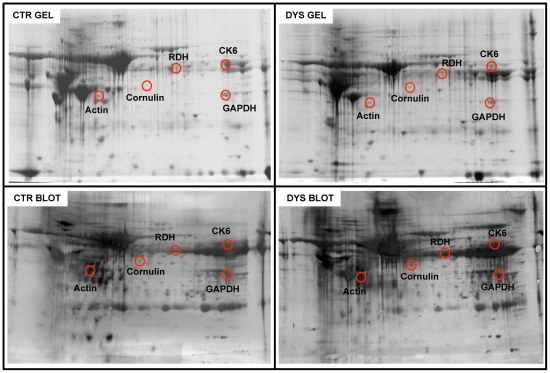
Figure 4. Oxidized protein detection by redox proteomics (DYS vs. CTR).
Top: 2D maps of CTR (left) and DYS (right) cervical tissues. Proteins (300 µg) were separated in first dimension (pH 3–10 linear IPG); second dimension was performed on slab gel (12% gradient SDS-PAGE). Protein detection was achieved using Biosafe Coomassie staining. Bottom: 2D carbonyl immunoblots of CTR (left) and DYS (right) cervical tissues. The spots showing significant increased carbonyl levels are labeled. Relative change in carbonyl immune-reactivity, after normalization of the immunostaining intensities to the protein content, was significant for five spots. The identified proteins are listed in table III.

