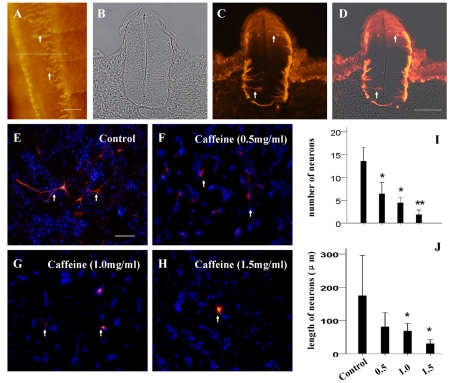
Figure 5. Caffeine induced suppression of neuron proliferation and differentiation.
A–D: Neurofilament expression pattern of normal developing neural tubes in the whole-mount embryo (A) and transverse sections (B-bright-field; C-fluorescence; D-merge). The white arrowheads indicate neurofilament positive neurons in the neural tube. E–H: The disassociated chick embryo brain cells were treated with different concentrations of caffeine for 24 hours. Following which, the number of neurofilament positive cells in the caffeine-treated was reduced in comparison to the control (E,I). Also, the neuron length decreased after caffeine treatment (J). Scale bar = 100 µm in A, 50 µm in B–D and 100 µm in E–H.

