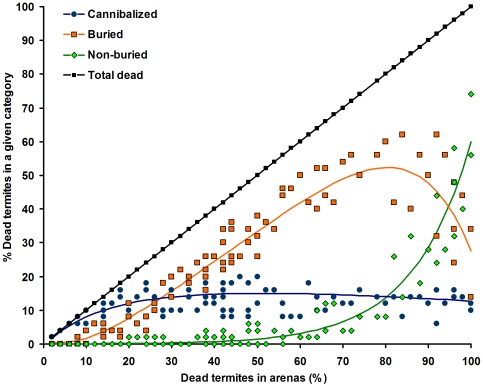
Figure 2. Distribution of dead individuals among three categories: cannibalized, buried and non-buried as a function of the ratio of dead termites within a group.
Detailed analysis is in Datasets S3, S4, S5, and S6 in Supporting Information. Superimposed data points are not represented in the figure but were used for the analysis.

