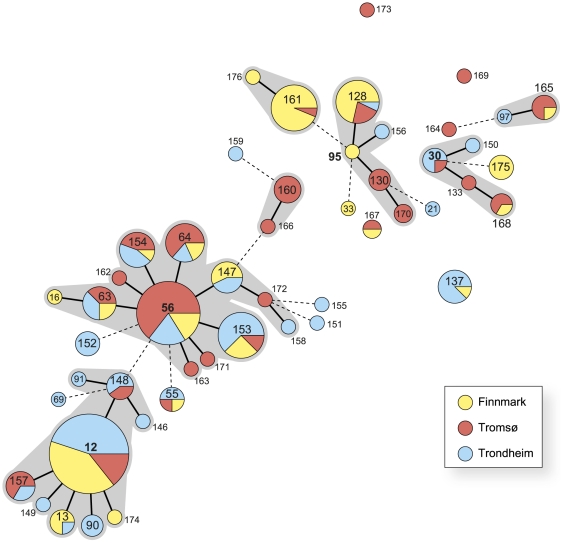
Figure 1. Minimum spanning tree analysis based on 50 multilocus sequence types (STs) in 248 chlamydia specimens.
The 50 circles correspond to different STs discriminated by multilocus sequence typing (MLST). Each circle represents an ST, and ST number is given inside or next to the circle. Circle size reflects the number of isolates. Bold black lines connect single-locus variants (SLV). Broken lines connecting double-locus variants are only indicative as several alternative links with equal weight may exist. The coloured pie charts indicate ST geographic distribution. Grey shaded areas define clonal complexes i.e. clusters of genetically related STs with only one allele difference.

