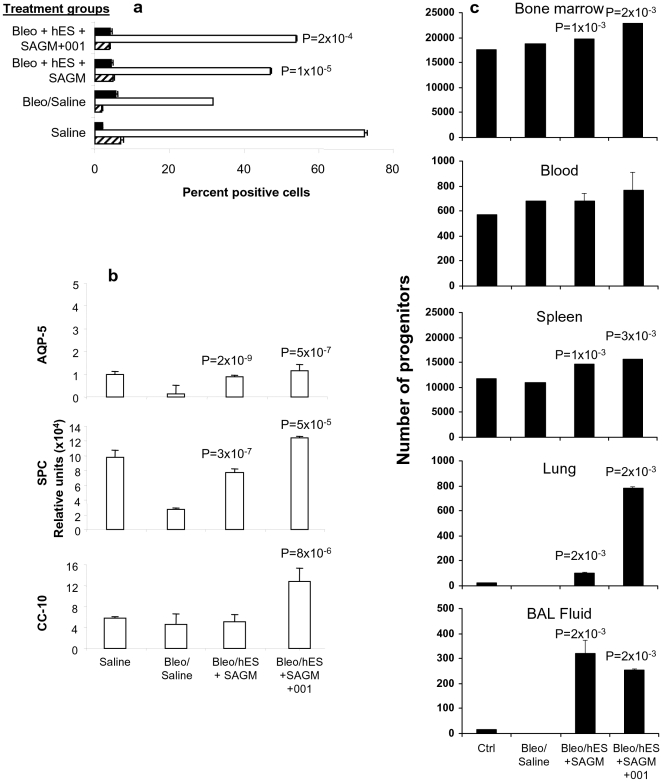
Figure 8. Effect of differentiated H7 hES cells on airway epithelial cells and progenitors in bleomycin-treated mice.
Lungs of control (saline-treated) Rag2γC−/− mice (Saline group), bleomycin-treated Rag2γC−/− mice administered saline (Bleo/Saline group), and bleomycin-treated Rag2γC−/− mice transplanted with 105 H7 hES cells differentiated in SAGM in the either the absence (Bleo/hES+SAGM group), or presence of 5 µM ICG-001 (Bleo/hES+SAGM+ICG-001 group) underwent a FACS or b qPCR analyses for expression of AQP-5, SP-C, and CC-10 markers of AEI cells, AEII cells, and Clara cells respectively. a Percent positive cells in lung tissues digested by collagenase type IV treatment for FACS analysis of alveolar epithelial cells ± SEM. n = 4 per group. *P value<0.05 compared to d 14 bleomycin-treated non-transplanted mouse lung. Symbols used are: CC-10 (solid bars), AQP-5 (open bars), and SP-C (hatched bars). b Lung tissue was homogenized, total RNA extracted, and mRNA expression for AQ-5, SP-C, and CC-10 detected by qPCR as calculated by relative index of Ct values normalized to GAPDH by qPCR and shown as relative units. P<0.05 compared to bleomycin-treated non-transplanted lung values are shown. c To quantitate hematopoietic progenitors, CFU-C were counted after culture in semi-solid methylcellulose from bone marrow, blood, spleen, lung, and BAL fluid obtained from the study groups. 7 days after culture, the number of bone marrow cell CFU-C was expressed as total number of cells derived per femur, blood CFU-C per 1 ml of plated heparinized whole blood, and spleen CFU-C per spleen. 14 days after culture, lung parenchymal and BAL fluid cell CFU-C were calculated as per single lung. CFU-C was performed in duplicate in three independent experiments with n = 4 mice per study group in each experiment; CFU-C are expressed as mean ± SEM with P<0.05 compared to the Bleo/Saline group shown.

