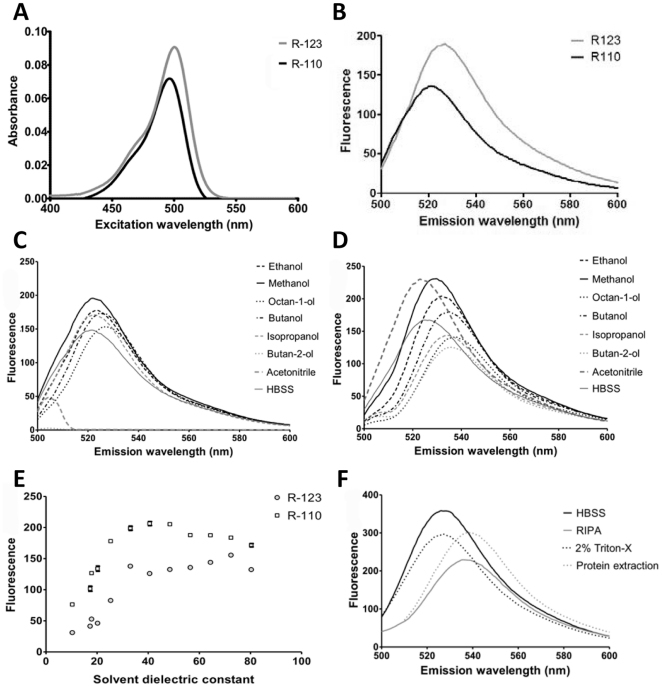
Figure 2. Spectroscopic characteristics of R123 and R110.
1 µM R123 or R110 were prepared in 1% (v/v) MeOH:HBSS. (A) λmax for excitation of each fluorophore was determined using a wavelength absorbance scan (400–600 nm), and (B) λmax for emission determined using a wavelength scan (500–600 nm) with a fixed λex = 505 nm. (C+D) 1 µM R123 or R110 in 1% (v/v) indicated sovent:HBSS were examined with an emission wavelength scan (500–600 nm) with a fixed λex = 505 nm for (C) R123 and (D) R110. (E) Quantum yield for R123 was determined for each solvent combination and plotted against solvent dielectric constant. (F) The impact of commonly used extraction buffers on R123 quantum yield was determined by addition of 1 µM R123 to extraction buffers, followed by an emission wavelength scan (500–600 nm) undertaken with a fixed λex = 505 nm. All data are representative of at least three independent repeats.

