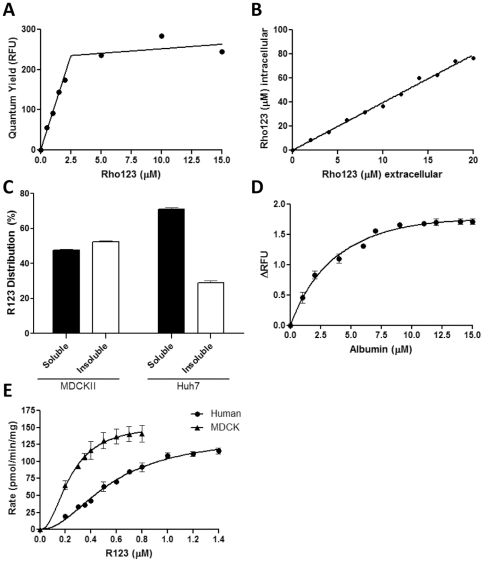
Figure 3. Passive uptake and sequestration of R123.
(A) Critical micelle concentration of R123 was determined by measuring quantum yield (λex = 505 nm, λem = 5251nm) of 0–0.5 µM R123 in 1% (v/v)MeOH:HBSS. (B) MDCKII-ABCB1 cells were incubated with 0–20 µM R123 for 10 minutes and intracellular R123 concentration determined against a standard curve following cell lysis with Triton ×100. (C) MDCKII or Huh7 cells were incubated with 10 µM R123 for 10 minutes and R123 concentration in soluble and insoluble cellular fractions determined against R123 standard curves. (D) Albumin binding was determined through the measurement of 0.1 µM R123 fluorescence following the addition of increasing quantities of 0–15 µM albumin. (E) S9 metabolic fractions were extracted from human liver samples and MDCKII cells and used at a final concentration of and respectively. The rate of conversion of R123 to R110 was determined following addition of 0.1 mg/ml or 1 mg/ml S9 fraction from MDCKII cells or human liver, respectively. Rate of conversion was determined for the indicated range of R123, and fitted using an allosteric sigmoidal model of enzyme kinetics. Data points are the average of three separate repeats ± S.D; where no error bars are observed, they are contained within the limits of the data point.

