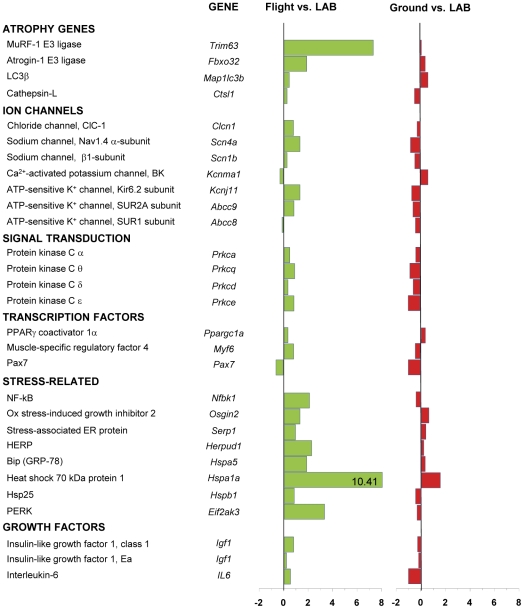
Figure 8. Variations in gene expression in EDL muscle induced by spaceflight.
Transcript levels were determined by real-time PCR for selected genes, classified on the basis of the functional role of the protein they encode. The numbers on the abscissa indicate the fold change in gene expression normalized for housekeeping gene. Numbers in the horizontal bars indicate the fold change when out of scale. The bars in green show the variation between the spaceflown mouse (Flight) and LAB mice, whereas the bars in blue show the variation between Ground and LAB control mice.

