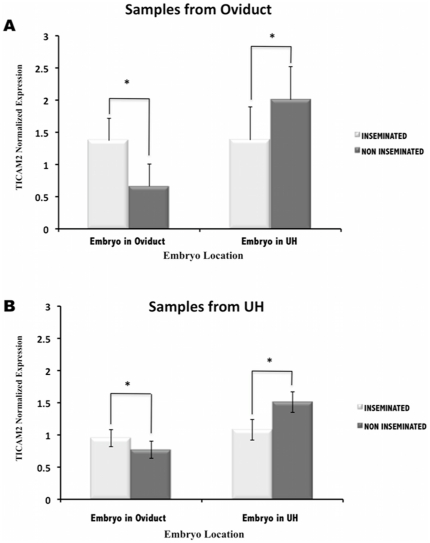
Figure 6. Spatial–course of TICAM2 expression in oviduct and uterine horn (UH) samples.
TICAM2 expression values (normalized based on ß–actin expression values) in oviduct (A) and UH samples (B) in the presence of embryos at different stages of development (Inseminated) and in the presence of oocytes (Non inseminated). Embryo was located in oviduct at 2 cells and 4 cells embryo stage; Embryo was located in uterine horn at 4 cells, morula and blastocyst). *(P<0.05).

