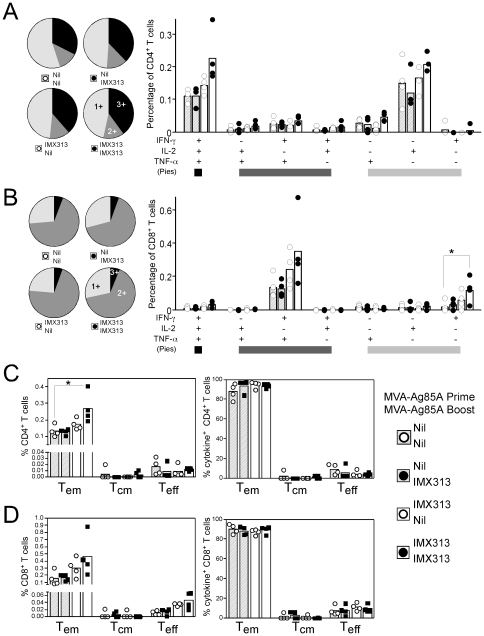
Figure 4. Quality of the antigen 85A response in Balb/c mice.
A & B) Pie charts represent the proportion of CD4+ T cells (A) or CD8+ T cells (B) secreting either 1, 2, or all 3 cytokines measured, while the graphs represent the percentage of each cytokine subset as a frequency of all CD4+ or CD8+ T cells. C & D) Any CD4+ (C) or CD8+ (D) T cell secreting either IFN-γ, TNF-α or IL-2 was further subdivided into either CD62L−,CD127− Teff, CD62L−,CD127+ Tem or CD62L+, CD127+ Tcm cells and plotted as a percentage of the total CD4+ or CD8+ T cell population (left panel) or as a percentage of all cytokine positive cells (right panels). Bars represent the group mean response with each individual animal displayed as a single point. Data were analyzed with a 2-way analysis of variance; fusion to IMX313 was shown to induce a significant effect only for the absolute frequency of cytokine+ CD8+ T cells (B graph p = 0.0145) and absolute frequency of memory subset CD4+ T cells (C left panel p = 0.0337). No interaction between prime-boost combination or cytokine subset was observed in any experiment and when analyzed with a post-hoc Bonferroni test; the asterisks denote the level of statistical significance (*p<0.05).

