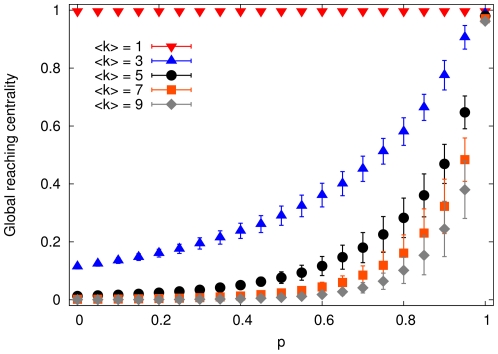
Figure 3. The global reaching centrality at different p values in the adjustable hierarchical model.
All curves show averages over an ensemble of 1000 networks with  and different average degrees. Standard deviations grow with
  , but they are clearly below the average values of the GRC. Note that for larger density, it is less likely to obtain the same level of hierarchy.

