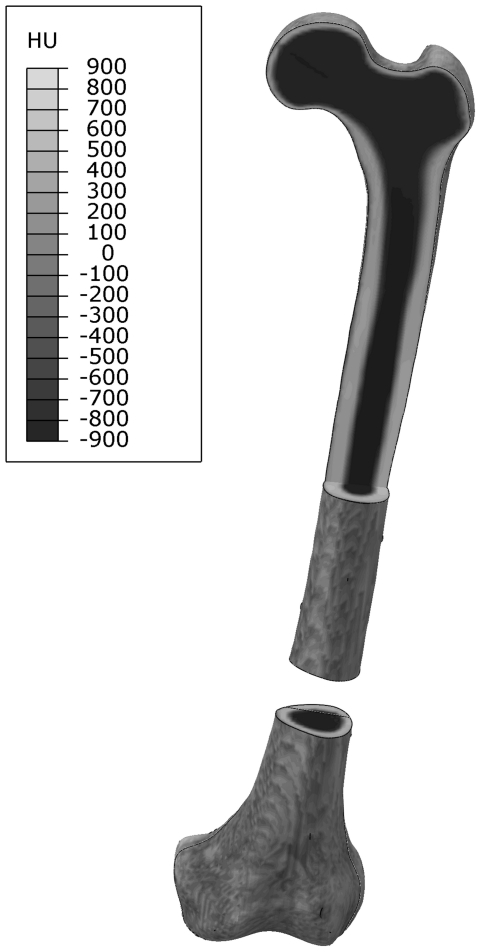
Figure 2. Distribution of the material properties along the femur.
Femur with its segmental defect at the lower third is shown. An additional view cut in the frontal plane was created at the proximal end to show the cortical structure along the femoral axis. Dark colour represents areas with low HU values, e.g. air and cancellous bone, light colour represents areas with high HU values, i.e. cortical bone.

