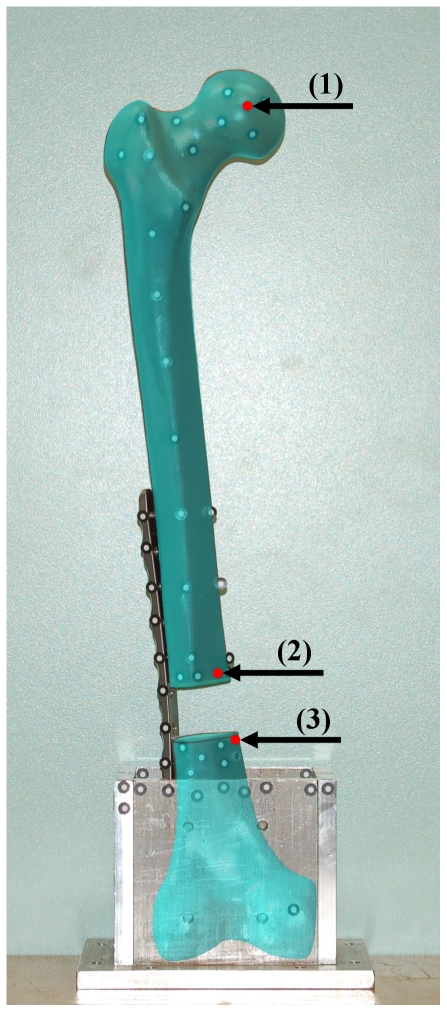
Figure 8. Alignment of the marker points to the FE model.
Overlay plot of the test setup picture with the marker points and the FE model within the FE software package. By using the translucency for the FE model the position of the marker points could be adapted to the FE model. Red marks show position of the nodes, used for the calculation of the femoral head deflection (1) and for the gap alteration (2 and 3).

