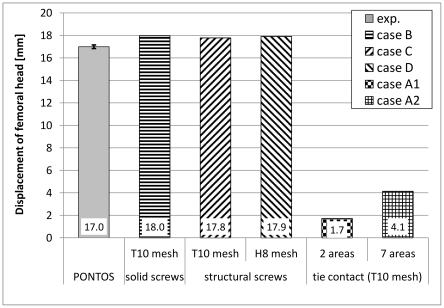
Figure 9. Results for the femoral head displacement.
Results were obtained from the experimental testing (Pontos) and the five numerical analyses. Mean value and standard deviations are shown for the experimental data, while magnitudes of femoral head displacement are shown for the data of all numerical models. All results were achieved at a load of 227 N.

