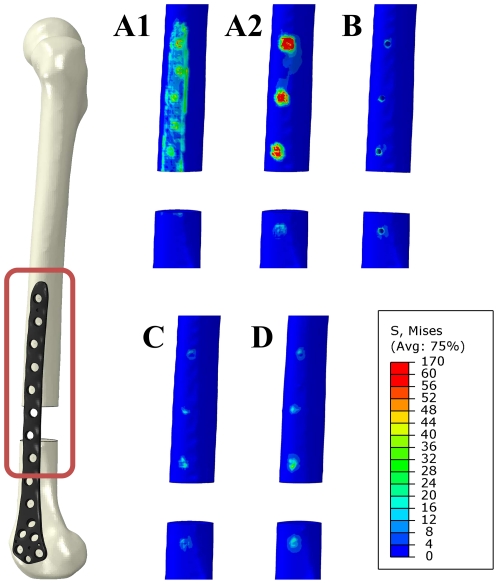
Figure 12. Stress distribution within the area between the bone and the osteosynthesis plate.
Results are shown on the surface of the bone (marked with red rectangle on the right). An upper limit of 60 MPa was set for comparison of all cases. Stresses are shown on the lateral site of the femur without the osteosynthesis plate for both tied contact models (Case A1 and A2), the model concerning the screw holes (Case B) and both models with the implemented structural screws (Case C and D).

