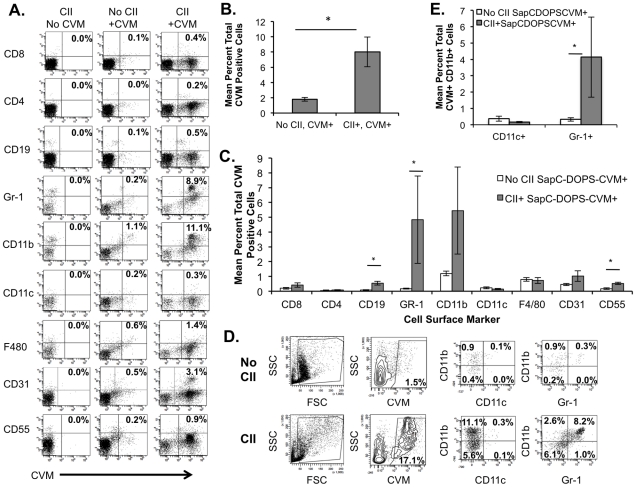
Figure 6. SapC -DOPS-CVM targets primarily CD11b+Gr-1+ joint cells in the CIA model of arthritis.
Cells were stained with antibodies to cell surface markers as indicated. FACS plots are representative from one animal, with bar graphs indicating the means +/− the SEM of groups. (A) Dot plots indicate cell populations from mice treated as indicated that are CVM+ and positive for other cell surface markers as indicated on left. (B) CVM+ cells. Columns represent mean of total cells that are CVM+ +/− SEM (error bars) with treatment of animals as indicated. * p<0.0001 Mann Whitney. (C) Columns indicate means +/− the SEM (error bars) of the percentage of total cells that are CVM + and positive for the indicated cell surface marker. * = p<0.05 Mann Whitney. (D) Dot plots show forward (FSC) and side scatter (SSC) for joint populations with gating for CVM +cell populations versus side scatter (SSC). Gated CVM + cells are further analyzed for combinations of the specific cell-surface markers CD11b, CD11c and Gr-1 as indicated. (E) Columns represent the mean +/− the SEM (error bars) of the percentage of total cells that are positive for CVM, CD11b, and also positive for either CD11c or Gr-1. N = 4, No CII, SapC-DOPS-CVM; 8, CII+, SapC-DOPS-CVM+ * p<0.05, Mann Whitney.

