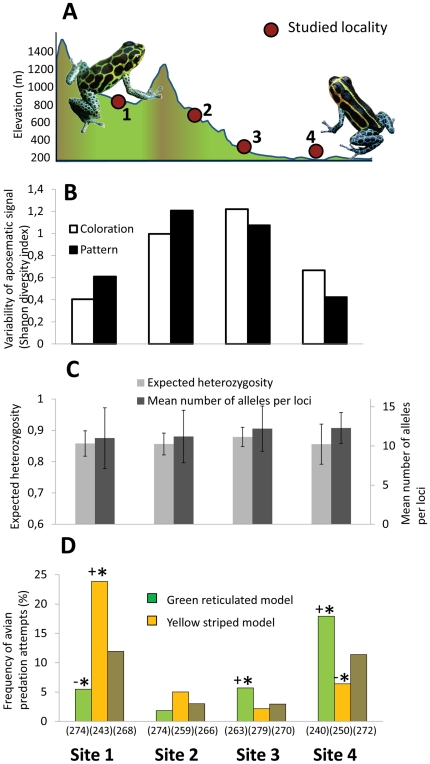
Figure 1. Phenotypic variability, genetic diversity and predation pressure measured in Ranitomeya imitator for the study sites.
(A) Topographic profile of the study system with the study sites along the 18 km transect. (B) Phenotypic variation within sites of both aposematic dorsal coloration and pattern measured using the Shannon diversity index. (C) Neutral genetic variation estimated from nine nuclear microsatellites loci in terms of expected heterozygosity and mean number of alleles per loci, and their associated standard deviation. (D) Avian predation frequency on each aposematic signal in each site. Within sites Freeman-Tukey deviates identify which model phenotype suffered significantly (*) more (+) or less (−) predation attempts and are indicated above the bars, and the sample size is specified below.

