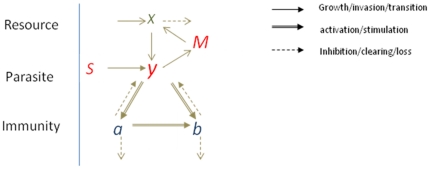
Figure 1. Schematic representation of the model.
The population of uninfected red blood cells (x) provides the source for the infected population (y). Level I immune effector (a) is stimulated by y. Level II immune effector (b) is stimulated by y interacting with a+b. M represents the the number of merozoites, S represents an external source of inoculation.

