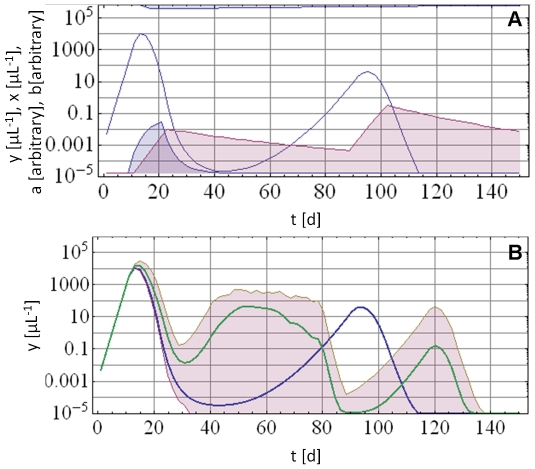
Figure 2. Deterministic pattern versus AV pattern.
Panel A: Typical deterministic parasite density pattern (solid blue line) as predicted by the model. Also shown are innate immune effector a (blue filled curve) and adaptive immune effector b (purple filled curve). Panel B: Corresponding stochastically predicted mean parasite density (solid green line) and minimum/maximum envelope (purple fill) for the same deterministic solution (solid blue line) as shown in Panel A.

