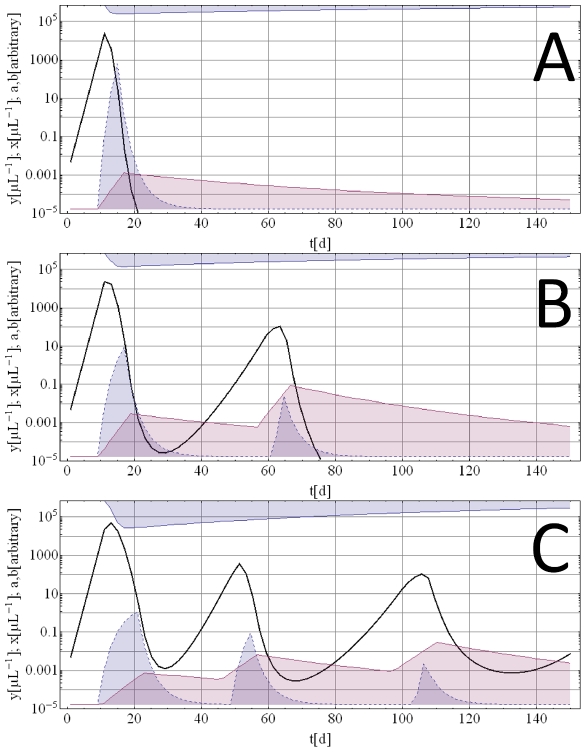
Figure 4. Typical deterministic histories starting from an immunologically naïve state with an initial inoculum.
Blue solid lines are parasitemia, the blue filled curve is immune effector a, the purple filled curve immune effector b, and the blue filled curve at the top are depleted resource cells. Deterministic histories can have single (Panel A), double (Panel B) and multiple (Panel C) wave patterns. However multiple waves patterns very rarely terminate and look very different from the MT data.

