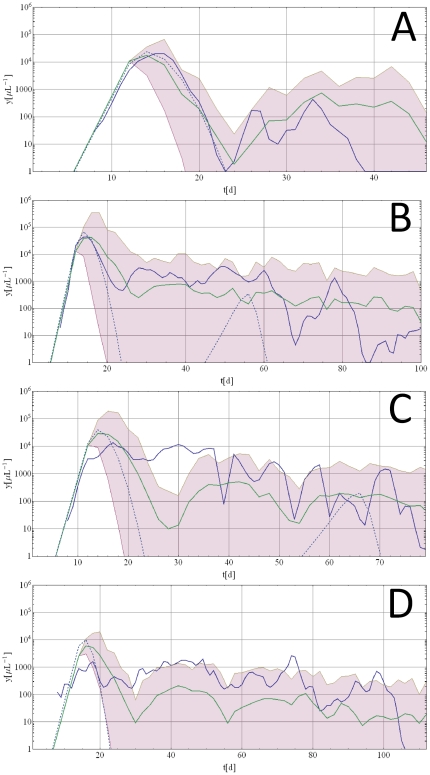
Figure 6. Long term, multiple wave datasets calibrated with the present model.
Panels A and B depict cases where the calibration resulted in a reasonable fit. The datasets are suitable because they exhibit an initial wave of parasitemia which contains the global maximum of the entire history. Panels C and D depict cases which are less suitable because they are missing a pronounced first wave of parasitemia. The blue solid lines are the original MT data, the dashed blue lines are the best fits to the first wave of parasitemia (1st calibration step), the purple shaded areas are the AV envelopes (2nd calibration step) with its mean curve (solid green line).

