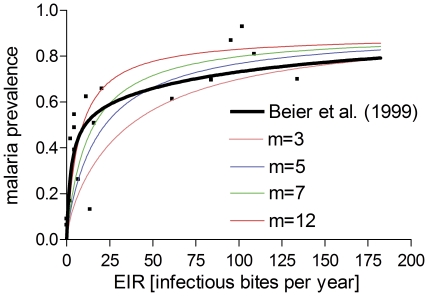
Figure 8. AB communities subjected to stationary EIR and comparison to field data.
The data points (black) are taken from a review conducted by Beier et al. (1999) [33]. The black line is the curve fit also given in that reference. The colored lines are model predictions based on different numbers of antigenically distinct variant clusters (m).

