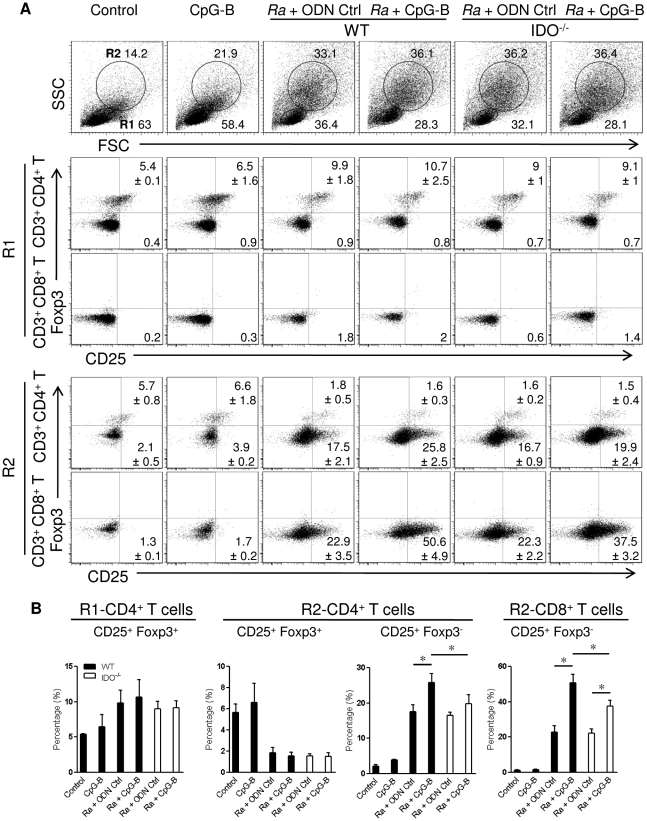
Figure 5. CpG-B treatment promotes T cell activation partially through IDO, without altering the frequencyof Treg cells.
At day 5 post-infection, spleen cells from individual mice (4 mice per group) were stained with the indicated cell surface markers and then for intracellular Foxp3. Based on forward scatter (FSC) and side scatter (SSC) parameters, two populations were defined as quiescent cells (region 1, R1) and activated cells (region 2, R2) (A). The percentages of CD25+ Foxp3+ Treg cells and CD25+ Foxp3− activated T cells gated in CD3+ CD4+ and CD3+ CD8+ T cells from R1 and R2 populations are shown as mean ± SD in the corner. Representative statistical data are shown from one of three independent experiments (B). * p<0.05.

