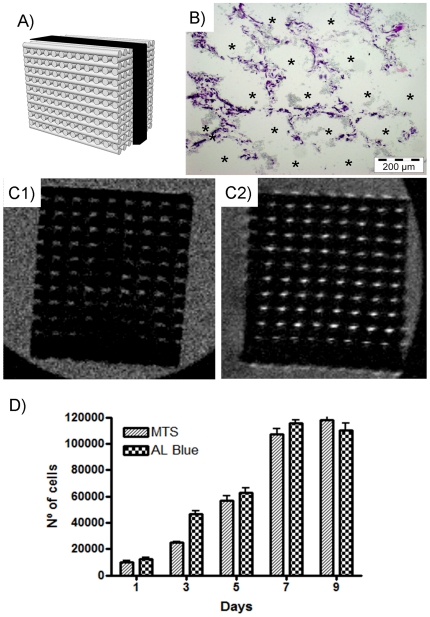
Figure 3. Inner-cells studies and quantification assays.
A) Scheme of cell-location studies. Black area correspond to studied area. B) Histology inner the robocasting structure. Asterisks show the location of ceramic rods, which are empty spaces due to performed sample decalcification. Note C2C12 cells located in entire scaffold structure. C) Non-destructive MRI images obtained inner scaffold structure. C1) Non cell-seeded scaffold C2) Cell seeded scaffold. Note brightness in most porous structure attributable to cell presence. D) Quantitative assays for cell proliferation measurement. Graphic represents the time course plot obtained in both MTS and Alamar Blue assays.

