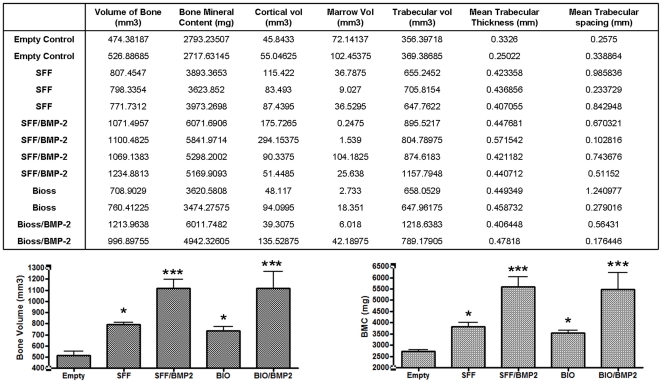
Figure 9. Implantation in pig maxillary defects: Data.
Table summarized data obtained from μCT studies (SFF, Robocast scaffolds; BIO, Bio-Oss). Graphic represent “Bone Volume” and “Bone Mineral Content” (BMC). Data in graphics are provided in mean and standard deviation. Significative differences stand for: * (p≤0.05), ** (p≤0.01), *** (p≤0.001).

