
Figure 2.
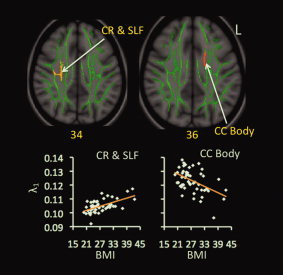
Correlations between BMI and λ1 values. Red‐yellow color on MNI T1 template indicates brain regions exhibiting significant correlations between BMI and λ1 values. The green color shows the “group mean_FA_skeleton,” the number below each brain image indicates Z coordinates in MNI space, and only clusters surviving voxel level t > 2.0 and cluster P < 0.05, FWE‐corrected for multiple comparisons of voxel‐wise whole‐brain analysis are shown. Scatter‐plots demonstrate correlations between BMI values (x‐axis) and mean values of λ1 (y‐axis) within each indicated cluster. Abbreviations: CC = corpus callosum; CR = corona radiata; L = left; SLF = superior longitudinal fasciculus.