
Figure 3.
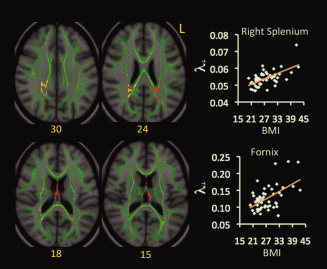
Correlations between BMI and λ⟂ values. Red‐yellow color on MNI T1 template indicates brain regions exhibiting significant correlations between BMI and λ⟂ values. The green color shows the “group mean_FA_skeleton,” the number below each brain image indicates Z coordinates in MNI space, and only clusters surviving voxel level t > 2.0 and cluster P < 0.05, FWE‐corrected for multiple comparisons of voxel‐wise whole‐brain analysis are shown. Scatter‐plots demonstrate correlations between BMI values (x‐axis) and mean values of λ⟂ (y‐axis) within each indicated cluster. Different ranges are used on the y‐axes of scatter plots given range differences in λ⟂ values for the fornix and splenium. Abbreviation: L = left.