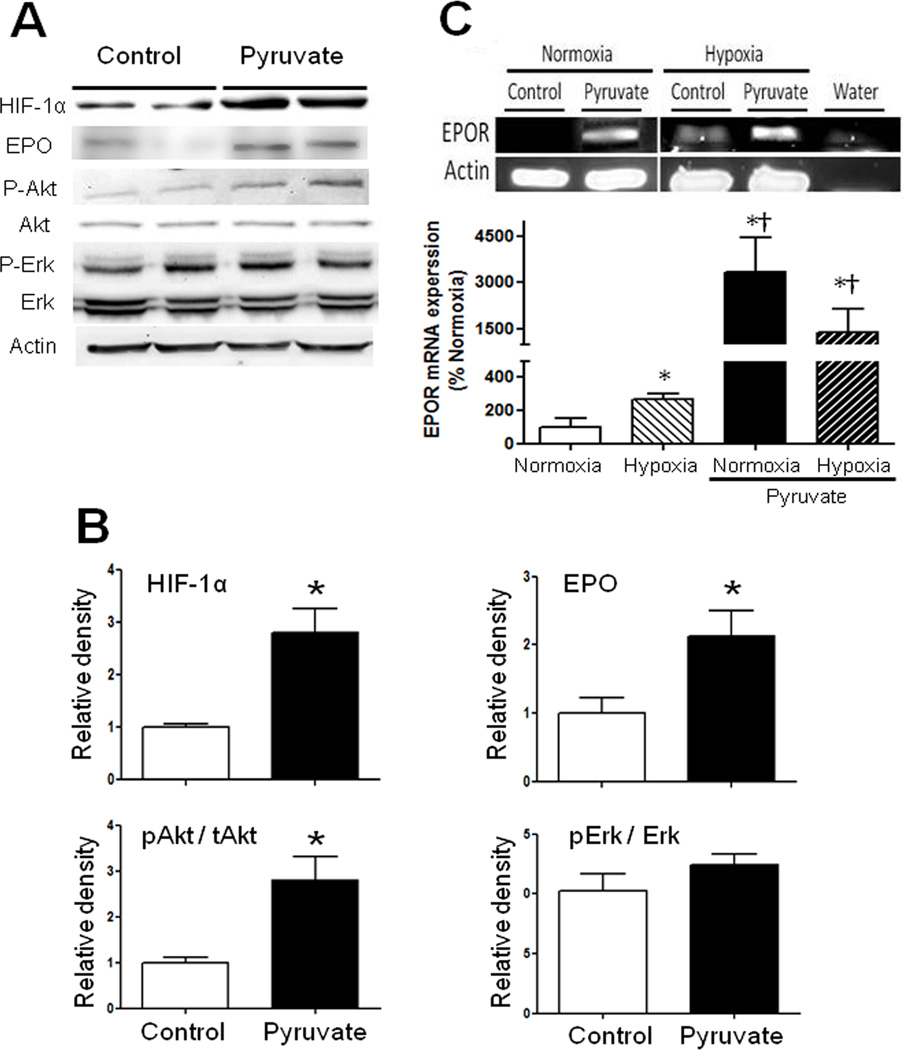
Figure 2. HIF-1α, EPO, pAkt/Akt, and pErk/Erk contents and EPOR mRNA expression in HT22 neuronal cells.
A) 10 mM pyruvate increased HIF-1α and EPO contents in parallel with Akt activation. B) Immunoblot band densities in pyruvate-treated cells were normalized to respective controls (*P<0.05 vs. Control). C) EPOR mRNA expression was evaluated with real time RT-PCR (*P<0.05 vs. Normoxic control; †P<0.05 vs. Hypoxic control).

