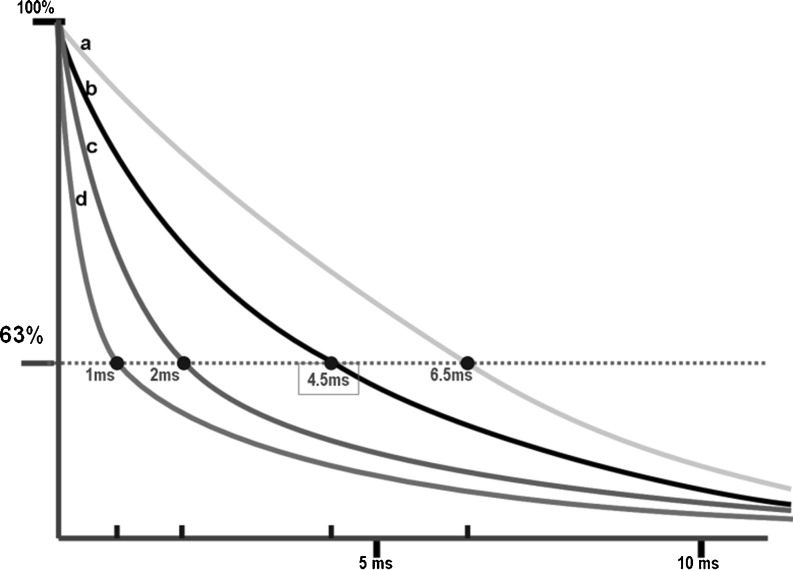
Fig. 1.
T2* transverse relaxation decay curves of signals from the liver in four theoretical examples with different LIC values. a Liver without iron overload, at the lower limit of the normal range (T2* = 6.7 ms). b Liver with slight iron overload (T2* = 4.5 ms). c Liver with high iron overload (T2* = 2 ms). d Liver with very high iron overload (T2* = 1 ms)

