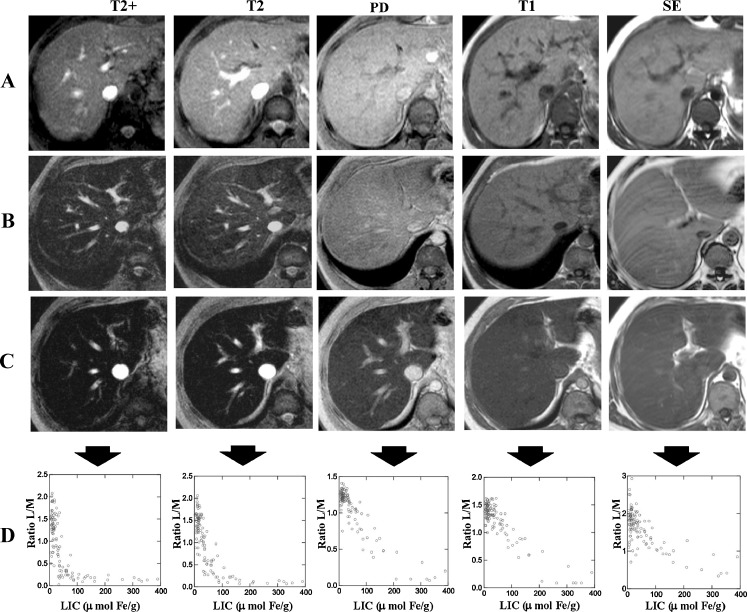
Fig. 6.
MRI sequences of the method of Gandon et al in three patients with different levels of LIC. a Patient without iron overload. b Patient with moderate iron overload. c Patient with high iron overload. d Scatterplots of L/M ratio and LIC for each MRI sequence. There is a maximal decrease in liver SI with most T2-weighted sequences. SE spin echo T1 sequence, PD proton density sequence (see [25])

