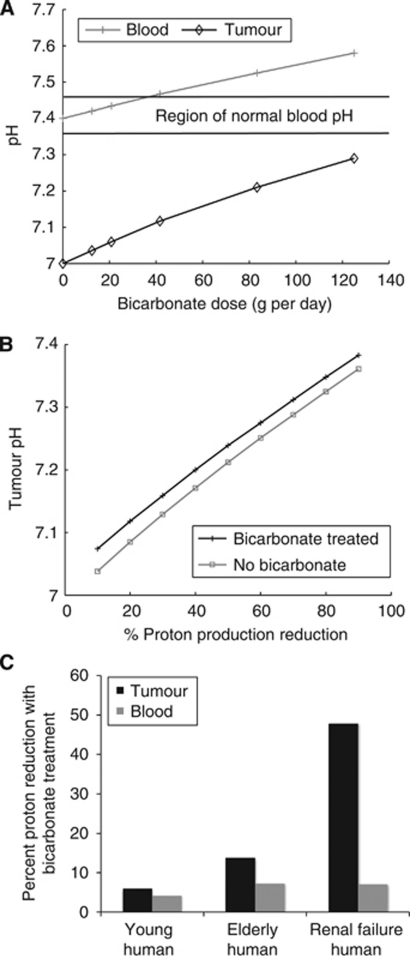
Figure 5.
(A) Simulated bicarbonate dose response plot in humans, noting the change in pH of the blood (grey crosses) and tumour (black diamonds). The black horizontal lines denote the region of normal blood pH. At a dose of about 35 g of bicarbonate, the predicted tumour pH is elevated to 7.10, with a blood pHe of just below the threshold of systemic alkalosis. Any dose higher than this will potentially elevate the blood pHe into a dangerously high level. (B) Predicted effect of proton reduction (where the x axis is percent reduction in tumour proton production rate) via a proton inhibitor without bicarbonate (grey squares) or with bicarbonate treatment (black stars). Reducing proton production elevates tumour pHe, but reduces bicarbonate effectiveness. Nevertheless, the net effect of combination therapies that reduce proton production and buffer the tumour could raise the tumour pHe above an ‘acidic threshold’ to promote normal stromal cell function. (C) Blood and tumour proton reduction with bicarbonate treatment in young humans (‘young’), elderly patients with mild renal impairment (‘elderly’) and those with chronic renal failure (‘renal failure’). Although the untreated blood is more acidic in patients who are elderly or with chronic renal failure, decreased renal function causes an increased treatment efficacy.

