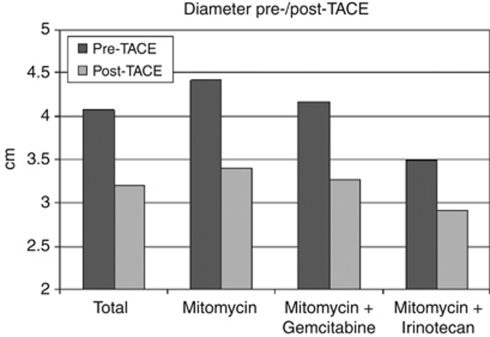
Figure 1.
Bar graph showing the mean diameters of the lesions after TACE (light grey) compared with the mean diameters before TACE (dark grey). For each patient group, the obtained data is represented as two columns grouped together. The groups of columns are ordered from left to right as follows: results of all metastases, results of those treated by Mitomycin, results of those treated by Mitomycin-Gemcitabine and results of those treated by Mitomycin-Irinotecan.

